Figure 6.

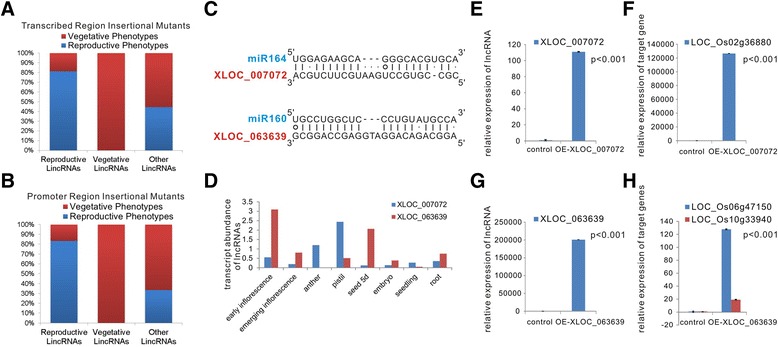
Functional analysis of rice lncRNAs. (A,B) The proportion of lncRNAs that are highly expressed during reproductive or vegetative stages or with unbiased expression patterns that display phenotypes that are related to reproductive growth or vegetative growth in their transcribed region insertional mutants (A) and promoter region insertional mutants (B). (C-H) Functional analysis of two miRNA ‘decoy’ lncRNAs. (C) Predicted base-pairing interaction of OsmiR164-XLOC_007072 and OsmiR160-XLOC_063639. (D) Transcript abundance of XLOC_007072 and XLOC_063639. (E) Detection of XLOC_007072 expression in the control vector and in the XLOC_007072-overexpression vector in transiently transformed rice protoplasts using qRT-PCR. (F) qRT-PCR analysis of the OsmiR164 target gene in the control vector and in the XLOC_007072-overexpression vector in transiently transformed rice protoplasts. (G) Detection of XLOC_063639 expression in the control vector and in the XLOC_063639-overexpression vector in transiently transformed rice protoplasts using qRT-PCR. (H) qRT-PCR analysis of OsmiR160 target genes in the control vector and in the XLOC_007072-overexpression vector in transiently transformed rice protoplasts. The values shown in (E-H) are means ± standard deviation. Actin2 was used as the reference gene (n =3 replicates). Significant differences were identified at the 1% probability level using Student’s t-test.
