Figure 7.

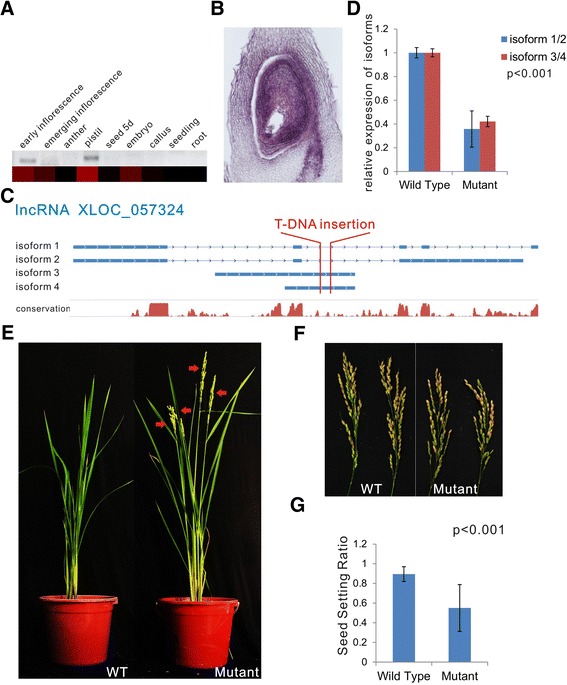
Functional analysis of lncRNA XLOC_057324. (A) Confirmation of the expression pattern of XLOC_057324 using semi-quantitative PCR. A heatmap was generated from the FPKM values and was used to visualize the lncRNA expression pattern in the RNA-seq data. (B) Spatial expression pattern analysis of XLOC_057324 based on in situ hybridization. (C) Isoforms and conservation of XLOC_057324; the T-DNA insertional site of the mutant analyzed in this study is marked in red. (D) Relative expression levels of XLOC_057324 isoforms in the mutant plants detected using qRT-PCR. (E) Phenotypes of wild-type (WT) plants and mutant plants during flowering; panicles are marked using red arrows. (F,G) Panicles (F) and seed setting ratios (G) of wild-type and mutant plants after harvest. The values shown in (D,G) are means ± standard deviation;n =3 replicates in (D); n =20 plants in (G). Actin2 was used as the reference gene. Significant differences were identified at the 1% probability level using Student’s t-test.
