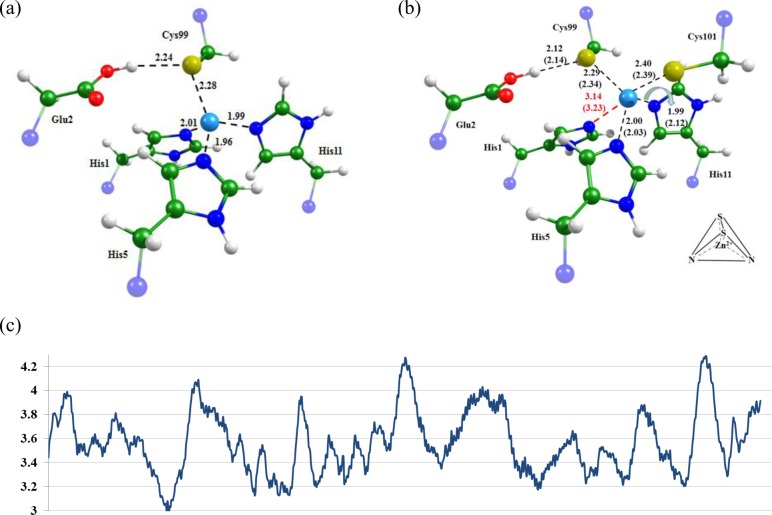
Figure 1.
Equilibrium geometry configurations obtained for (a) MMP-9–Inhpro and (b) MMP-9–Regasepin1 complexes; distances are shown in angstroms (Å). For the MMP-9–Regasepin1 complex, the distances in parentheses were obtained in QM/MM minimization with the BLYP/GPW-QZV2P and CHARMM approaches. Panel c illustrates variations in the distance between the nitrogen atom of His1 and the Zn2+ along the MD trajectory in the MMP-9–Regasepin1 complex. Here and in Figures 2 and 3, the green, blue, red, white, and light blue colors correspond to carbon, nitrogen, oxygen, hydrogen, and zinc atoms, respectively.

