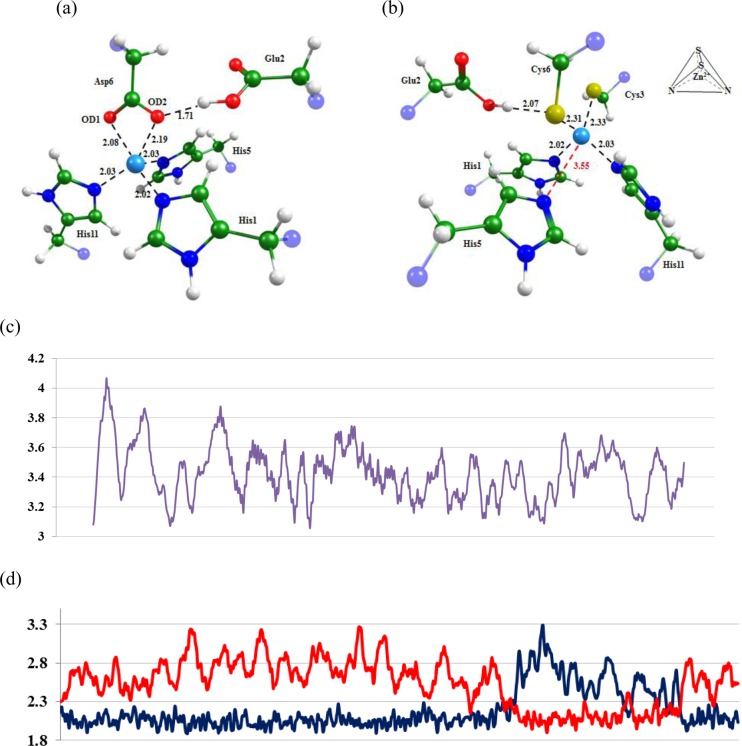
Figure 2.
Equilibrium geometry configurations obtained for the (a) MMP-2–APP-IP and (b) MMP-2–APP-IPZnF complexes. Graphs showing distances (Å) between atoms along MD trajectories: (c) corresponds to the distances between the nitrogen of His5 and the Zn2+ in the MMP-2–APP-IPZnF complex; (d) corresponds to the distances between Asp6OD1 (blue) or Asp6OD2 (red) and the Zn2+ in the MMP-2–APP-IP complex. See also Table 2.

