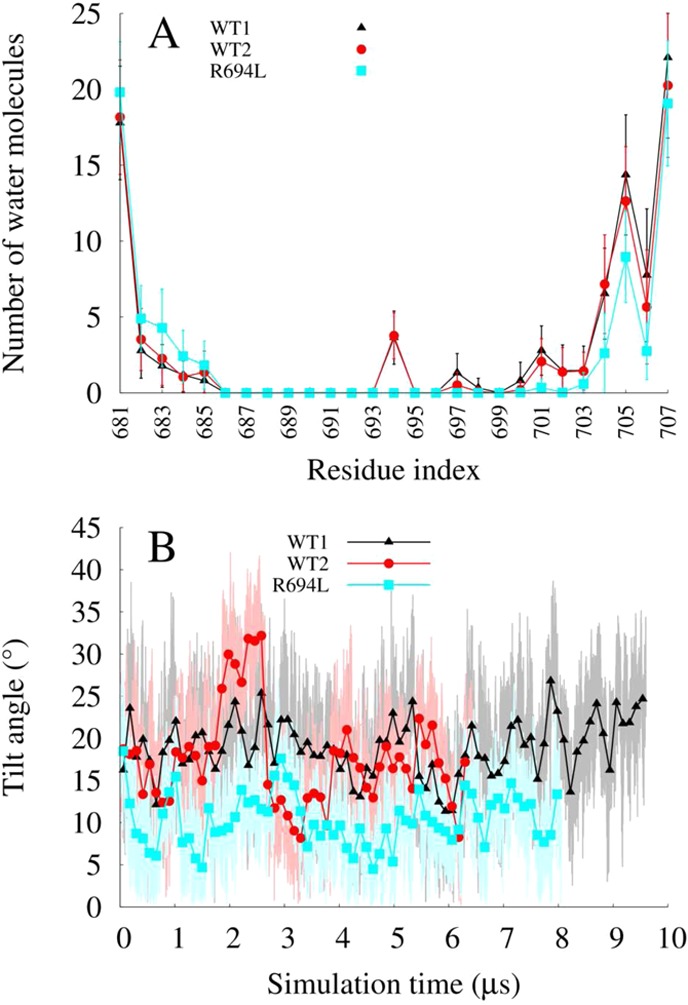
Figure 3.

(A) Number of unique water molecules within 4 Å of protein vs amino acid averaged over entire MD trajectories. Error bars represent the standard deviation. (B) Helix tilt angle from membrane normal in degrees vs simulation time in microseconds.
