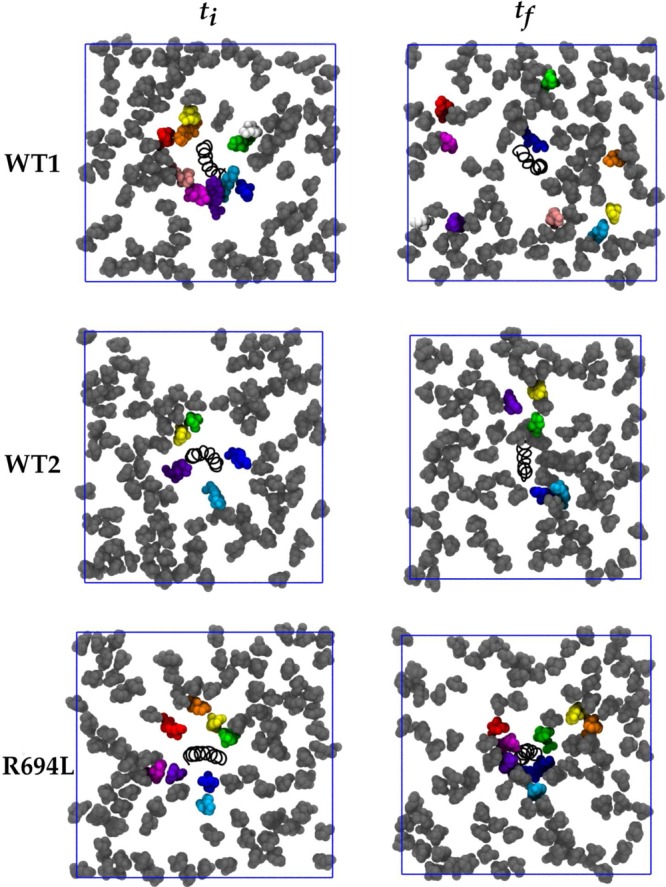
Figure 5.

Cholesterol molecules within 6 Å of protein in the lower leaflet in bright colors at the first simulation frame (ti) and the same molecules at the final simulation frame (tf). Cholesterol molecules are colored dark gray, and the protein is represented as a black spiral. Lipid molecules are not shown for the sake of clarity. The blue square represents the x and y periodic boundary conditions.
