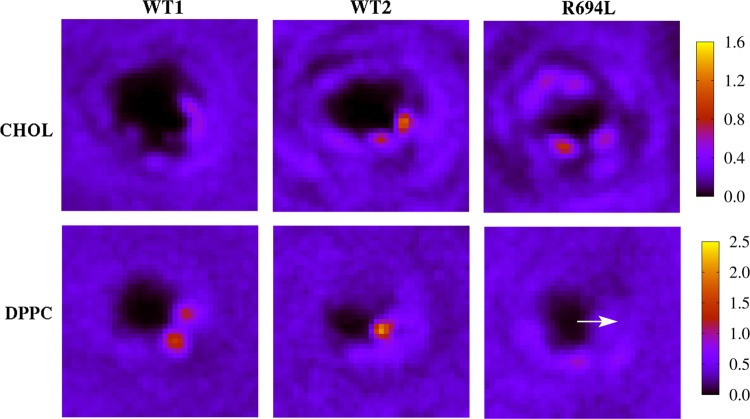
Figure 6.
Maps of average mass (amu) per frame 20 Å from protein in the lower leaflet for WT1, WT2, and R694L. The top row shows cholesterol hydroxyl oxygen mass and the second row DPPC phosphorus mass. The peptides are centered in x and y, and the azimuthal orientation of the midspan residue (arginine for WT1 and WT2 and leucine for R694L) is aligned along the x-axis in each map, as shown by the white arrow in the bottom right panel.

