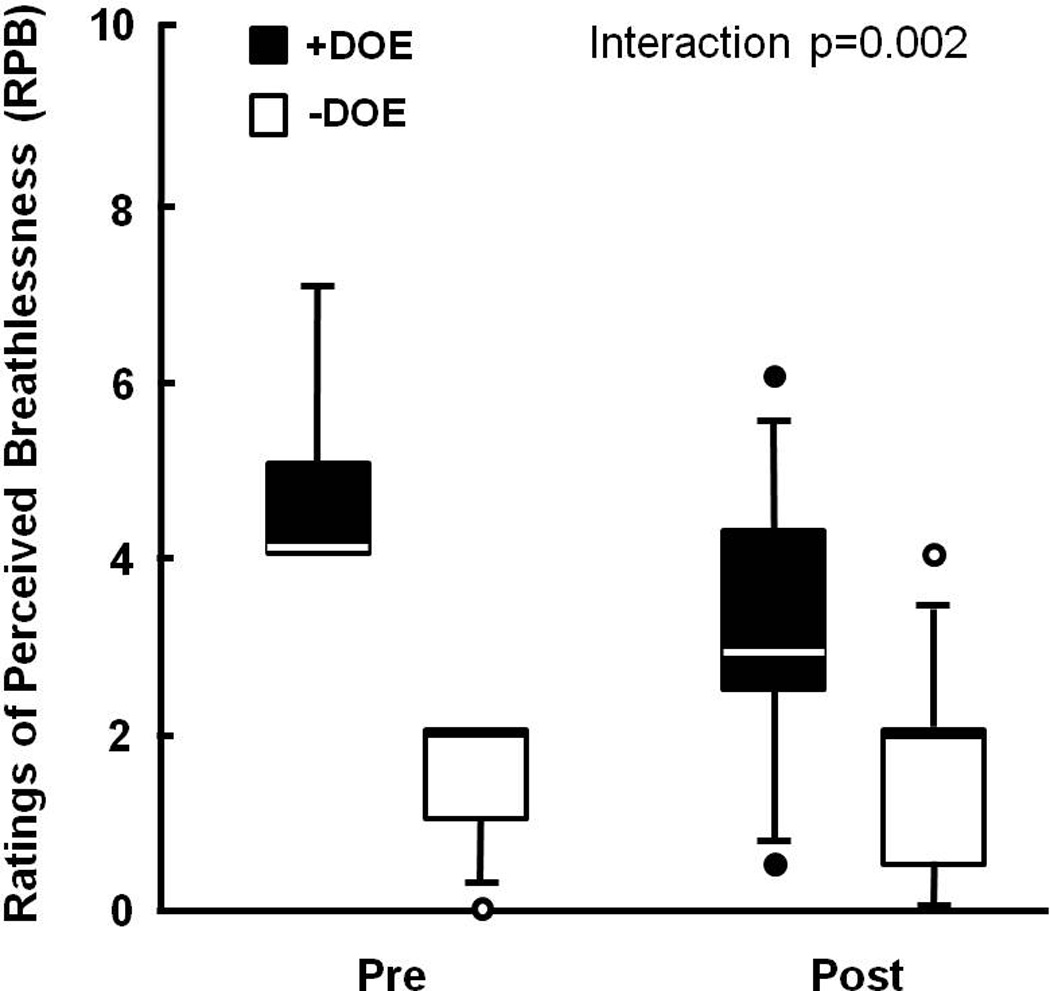
Figure 2.

Individual and group averages for Ratings of Perceived Breathlessness (RPB) before and after weight loss. RPB significantly decreased only in the +DOE group (Group × Weight Loss interaction p = 0.002). Box plots define the 25th and 75th percentiles by the ends of the boxes, with a line at the median and error bars defining the 10th and 90th percentiles.
