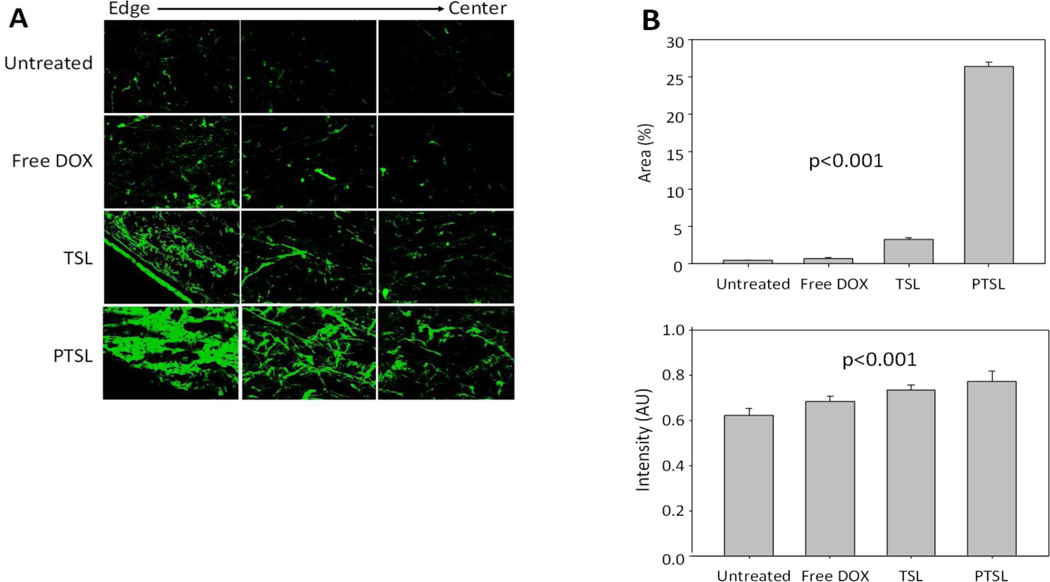
Figure 13.
Quantitative evaluation of tumor remodeling across different drug treatments. (A) Representative fluorescence microscopy images of tumor sections 14 days after treatment for morphological evaluation of extracellular matrix (ECM); (B) Percent fluorescence area and intensity in arbitrary units.

