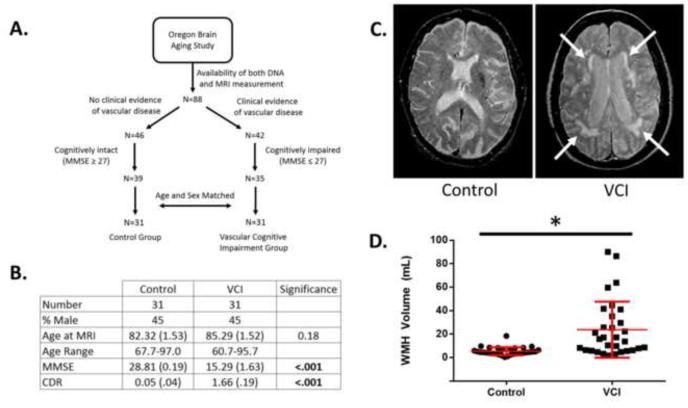
Figure 1. Phenotypic characterization of vascular cognitive impairment (VCI).
A. Selection criteria for subjects in the control and VCI groups. B. Demographic and neurocognitive characteristics of VCI and control groups. C. Representative T2-weighted MRI scans of a control and VCI subjects. White arrows indicate areas of WMH. D. Quantification of WMH volume in control and VCI groups. WMH Graph is a dot plot of each subject with mean +/− SD in red, whereas values in the table are mean +/− SEM. Differences in age and WMH were evaluated by unpaired Student’s t-test, and differences in MMSE and CDR were evaluated by a non-parametric Mann-Whitney test. * signifies p<.05.

