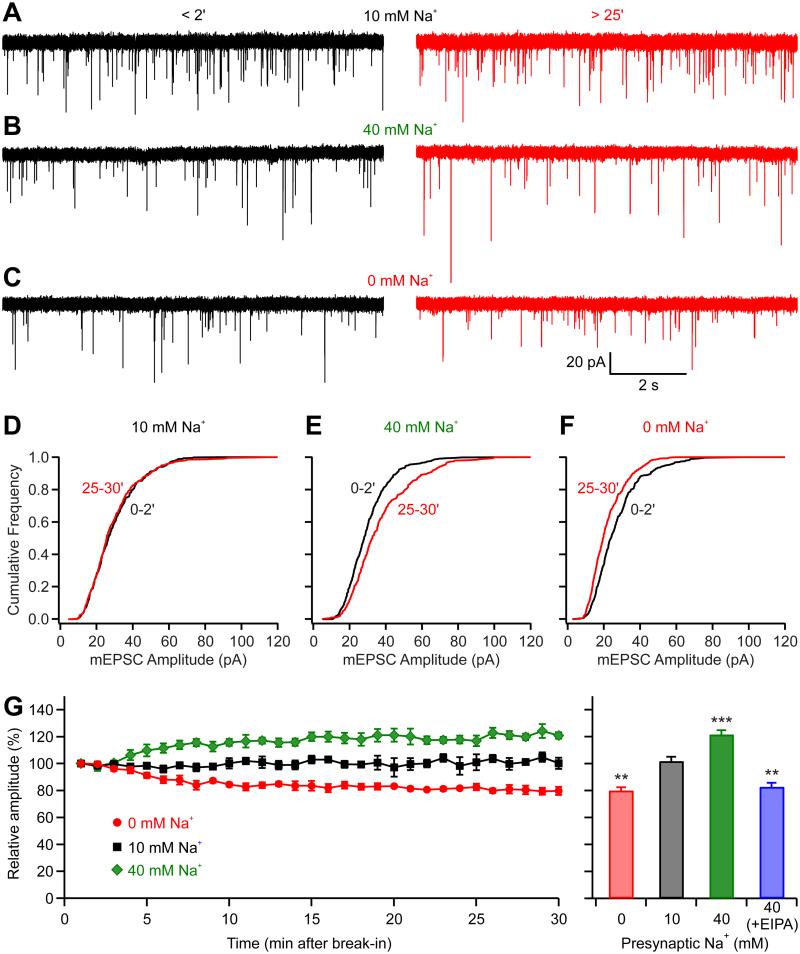
Figure 1.
Presynaptic intracellular Na+ regulates mEPSC amplitude. (A-F) Pair-recordings were performed from both presynaptic calyceal terminal and postsynaptic MNTB principal neuron. The presynaptic pipettes contained either 10 mM (A, D), 40 mM (B, E), or 0 mM (C, F) Na+, and the postsynaptic mEPSC were recorded. (A-C) Left panels were example recordings made < 2 min after presynaptic break-in while right panels were made > 25-min later. (D-F) Cumulative probability histograms of mEPSC amplitude early (black traces) and late (red traces) during dialysis are shown below the corresponding sweeps. (G) Time course of the average data from paired recordings for pipette solutions containing different Na+ concentration. Each point represents 1 min of recording. Right panel shows that mEPSC amplitudes at 25-30 min were relatively unchanged from those at 0-2 min when the pipettes were filled with 10 mM Na+ solution, while the amplitudes were reduced with solution containing Na+-free solution or increased significantly with 40 mM Na+ solution. When EIPA was added to the 40 mM Na+ solution, the mEPSC amplitudes were decreased rather than increased. **P < 0.01; ***P < 0.001; error bars, ± S.E.M.

