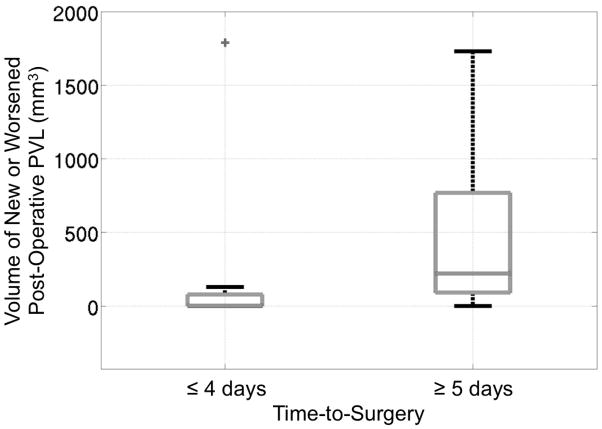
Figure 3.
Boxplot demonstrating the significant (p=0.0005) difference in volume of new or worsened post-operative PVL for those patients with a time-to-surgery of 4 days or less and those with a time-to-surgery of 5 days or more. Two outliers were removed to improve visualization. One outlier was in the left group and had a PVL volume of 7577.7 mm3, and the other outlier was in the right group and had a PVL volume of 4981.5 mm3. These outliers were only removed from the figure but not from any statistical analysis.

