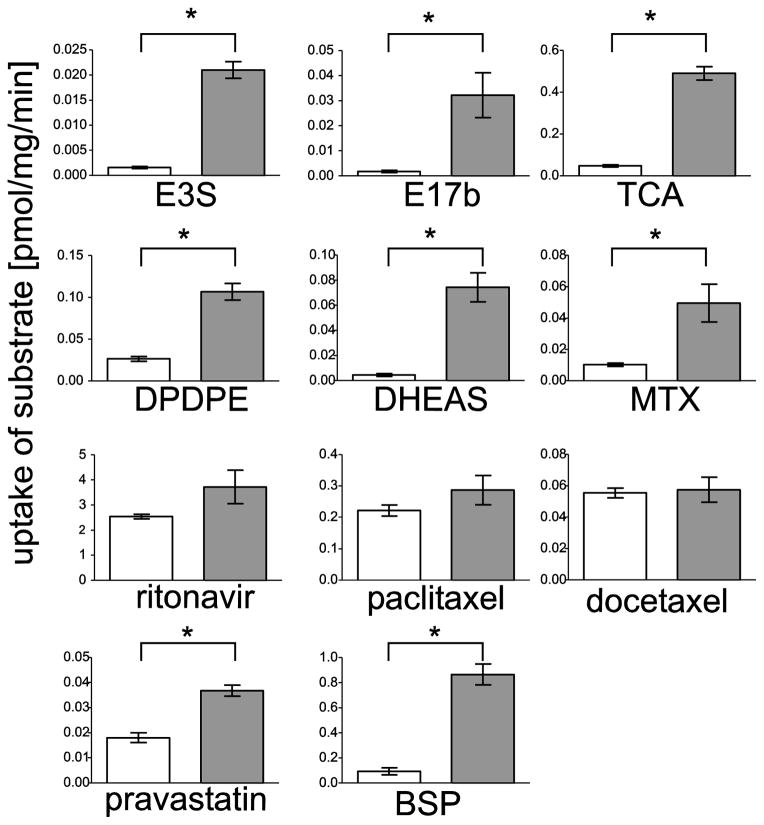
Figure 3.
Functional characterization of rtOatp1d1 in HEK293 cells. 24 h after transfection, cells were incubated for 5 min with [3H] TCA (30.0 nM), [3H] E3S (6.6 nM), [3H] MTX (13.9 nM), [3H] E17βG (6.1 nM), [3H] BSP (20.7 nM), [3H] DPDPE (6.7 nM), [3H] DHEAS (3.8 nM), [3H] ritonavir (300.0 nM), [3H] paclitaxel (6.6 nM), [3H] docetaxel (5.0 nM) or [3H] pravastatin (40.0 nM). Values represent the mean ± SEM of technical triplicates. Differences in substrate uptake between rtOatp1d1-HEK293 (grey bars) and either eV-HEK293 (in case of DPDPE, DHEAS, TCA and MTX) or non-transfected cells (all others) (represented in white bars). Significant differences were statistically analyzed using a non-parametric Mann–Whitney test (* p<0.05).

