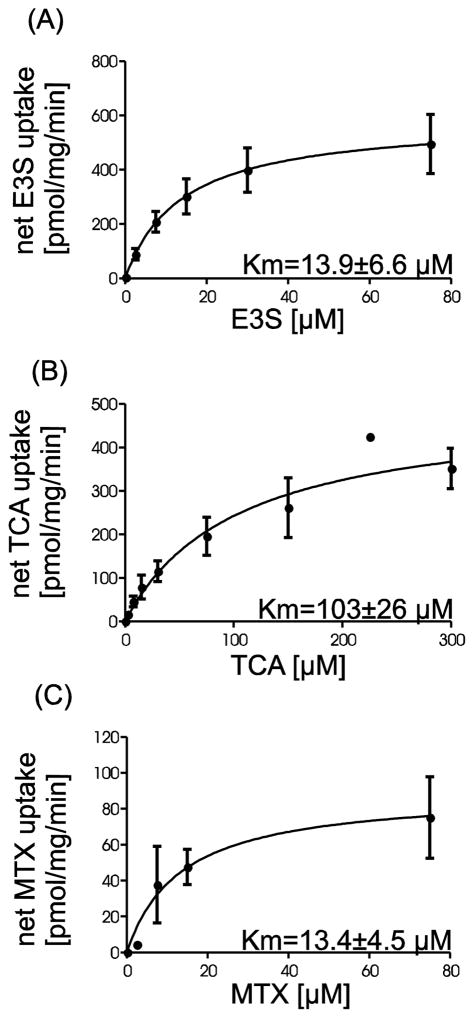
Figure 4.
Kinetic analyses of rtOatp1d1-mediated substrate uptake. Transport was measured within the initial linear uptake phase at 30 sec with varying concentrations between 0.1 μM and 75 μM or 300 μM respectively. (A) E3S (B) TCA and (C) MTX. Values depict mean ± SEM of five (A) or four (B) independent replicates with three technical replicates each. For MTX (C) three determinations of one replicate are shown. A nonlinear regression (Michelis-Menten) was fitted to the net uptake which was calculated by subtracting the unspecific uptake of the eV-HEK293 cells from the uptake of the rtOatp1d1-HEK293 cells.

