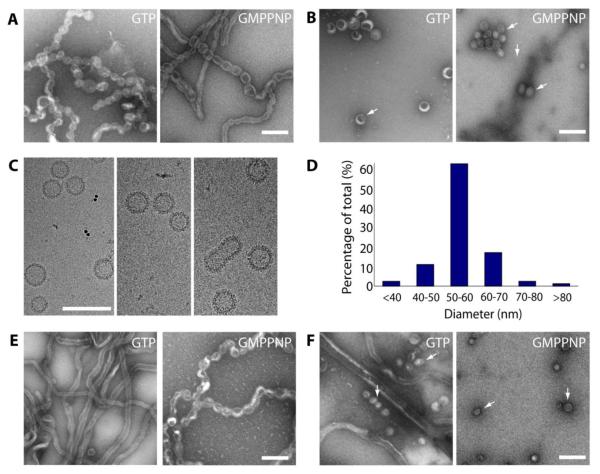
Figure 2. Formation of Sar1-coated vesicles.
Incubations with increasing concentration of Sar1 was followed by staining with 2% UAc and EM imaging. (A) After 10 minutes of incubation of Sar1H79G with GTP and GMPPNP, pseudo-vesiculated tubes appear. Scale bar = 100nm. (B) After 2 hours of incubation smaller Sar1-coated vesicles appear in both conditions (white arrows). Scale bar = 100nm. (C) CryoEM of Sar1H79G -coated vesicles. Scale bar = 100nm. (D) Statistical analysis performed on the cryoEM vesicles data set. (E) Incubations with wild type Sar1 in presence of GTP and GMPPNP for 10 minutes. Scale bar = 100nm. (F) After 2 hours of incubation smaller Sar1-coated vesicles appear in both conditions (white arrows). Scale bar = 100nm.

