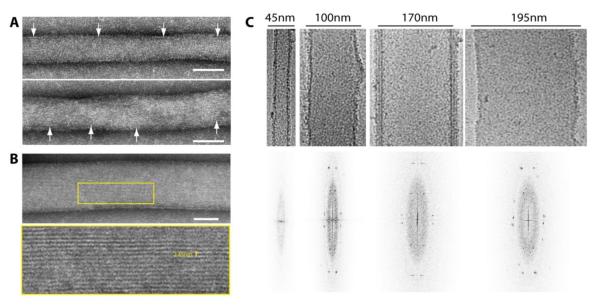
Figure 4. Formation of Sar1 ordered arrays on lipid tubules.
(A) Sar1H79G -coated tubes of diameter < 60 nm show spaced striations indicative of inconsistent Sar1 ordering. Arrows point to repeated banding detected on tubule surfaces. Scale bar = 50 nm. (B) Tubes of diameter > 60 nm show continuous striations that are ~2.45 nm apart as shown after zooming in on the yellow tracing. Scale bar = 50 nm. (C) CryoEM of Sar1H79G -coated tubes (upper panel) and their corresponding calculated Fourier transforms (lower panel).

