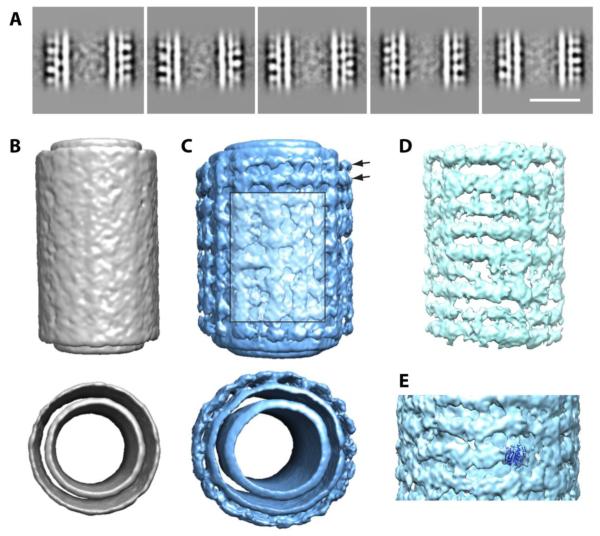
Figure 6. Sar1 forms locally ordered arrays on GalCer tubules.
(A) Reference-free classification of heavily coated tubes. Scale bar = 25 nm. (B) 3D reconstruction of naked GalCer tubes (side and top views are shown). (C) 3D reconstruction Sar1-coated GalCer tubes (side and top views are shown). Arrows point to area of ordered striations. Boxed area of lighter color shows local disordered Sar1 binding. (D) Front section of the difference map between naked and Sar1-coated GalCer tubes showing horizontal Sar1 straitions. (E) Fitting Sar1 crystal structure (PDB: 1F6B) into the 3D EM density of coated GalCer tubes.

