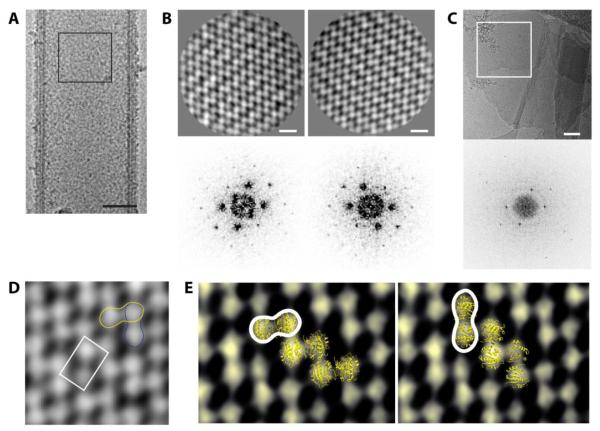
Figure 7. Ordered Sar1 arrays are composed of Sar1 dimers.
(A) The middle regions of thick/rigid tubes of similar diameters (~ 100 nm) were segmented to create a stack which was used for further averaging and classification. (B) Reference-free class averages (upper panel). Scale bar = 5 nm. Lower panel shows the computed Fourier transforms. (C) CryoEM of 2D lipid sheets coated with Sar1 (upper panel). Scale bar = 100 nm. FT of the area traced in white is shown (lower panel). (D) P222 space group represented on the 2D Sar1 lattice with the asymmetric repeating unit shown (white tracing). Yellow and blue tracings represent the regions that fit the Sar1 dimer. (E) Fitting of Sar1 dimer (PDB: 1F6B) into the electron density. Sar1 dimer can be fit in two possible scenarios (right and left).

