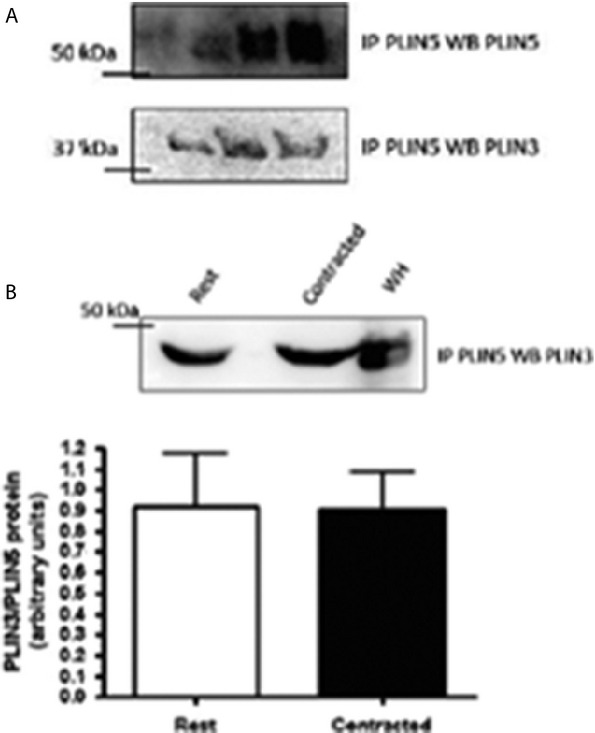
Figure 6.

Representative western blots of the interaction between PLIN3 and PLIN5 (n = 9). (A) Precipitated PLIN5 from red gastrocnemius whole homogenate samples, western blotted for PLIN5 showing up at approximately 52 kDa. Membrane from stripped and reprobed for PLIN3 showing up at approximately 47 kDa. (B) Representative western blot of immunoprecipitate PLIN5 samples probed for PLIN3. Graph depicting no change in the interaction between PLIN3 and PLIN5 at rest and following contraction (P = 0.65). IP: immunoprecipitate, WB: western blot, WH: whole homogenate.
