
Figure 1.
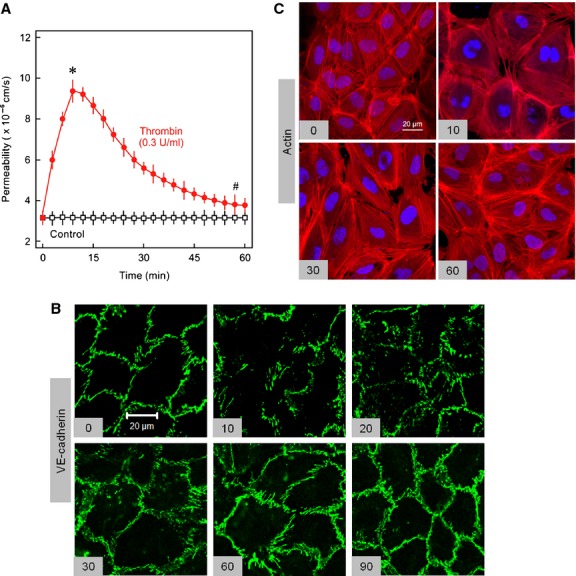
Dynamics of endothelial permeability, actin cytoskeleton, and AJs after thrombin challenge. (A) EC monolayers were exposed to thrombin (Thr; 0.3 IU/mL) or vehicle (control) as indicated and albumin flux (permeability) was measured as described in methods section. Mean ± SEM of three experiments of independent cell preparations, *P <0.05 versus control. (B) EC monolayers were exposed to thrombin (Thr; 0.3 IU/mL) for different time points (min) as indicated or vehicle, methanol fixed, and immunostained for VE‐cadherin or (C) paraformaldehyde (4%) fixed and stained with phalloidin‐TRITC for actin visualisation. Representative figures of three experiments of independent cell preparation.