Figure 3.

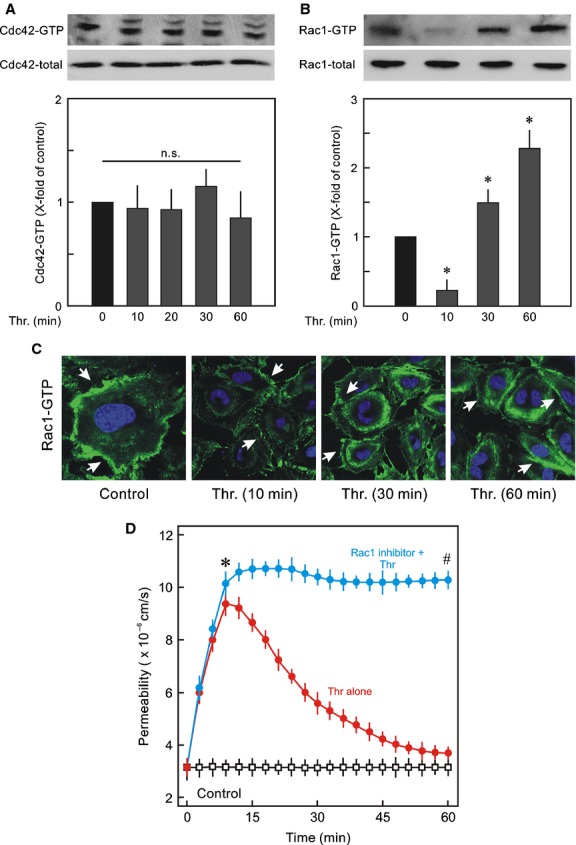
Dynamics of activities of cdc42 and Rac1. (A) Cdc42 activity; Representative Western blots of Rac1‐GTP and Rac1 total. EC monolayers were treated with thrombin (Thr; 0.3 IU/mL) for indicated time points or vehicle (0 min; control) and active Cdc42 was detected by pulldown assay. The active Cdc42 is given as x‐fold of control (0 min) taken as 1. Mean ± SEM of three experiments of independent cell preparations; n.s: not significantly different from control. (B) Rac1 activity; Representative Western blots of Rac1‐GTP and Rac1 total. The active Rac1 was detected by pulldown assay. The active Rac1 is given as x‐fold of control (0 min) taken as 1. Mean ± SEM of three experiments of independent cell preparations; *P < 0.05. (C) Localisation of active Rac1‐GTP in EC after thrombin treatment. EC monolayers were exposed to thrombin (Thr; 0.3 IU/mL) for different time points (min) as indicated or vehicle (control), PFA fixed, and immunostained for Rac1‐GTP using anti active Rac1 antibody. Representative images of three experiments of independent cell preparation. (D) EC monolayers were exposed to thrombin (Thr; 0.3 IU/mL) in the absence or presence of Rac1 inhibitor NSC23766 (50 μmol/L) or vehicle (control) as indicated and albumin flux (permeability) was measured. Mean ± SEM of three experiments of independent cell preparations; *P <0.05 versus control, #P <0.05 versus Thr alone.
