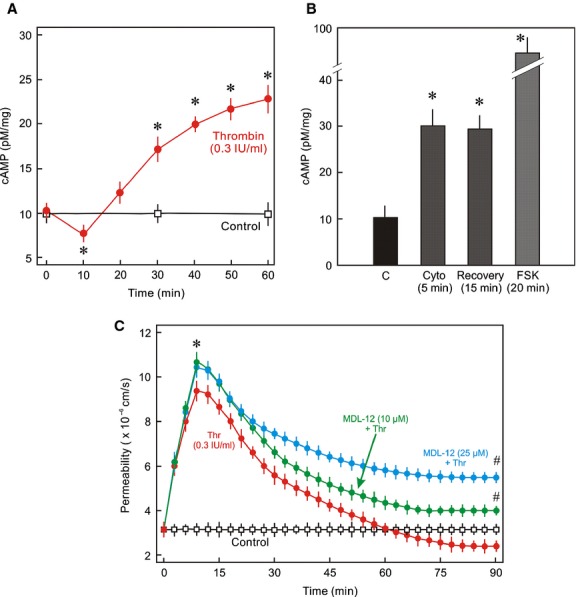
Figure 5.

Dynamics of intracellular cAMP levels during EC barrier restoration. (A) Intracellular cAMP levels during the recovery. EC monolayers were treated with thrombin (Thr; 0.3 IU/mL) or vehicle (C; control) for indicated time periods and cAMP levels were measured by ELISA (Mean ± SEM of three experiments of independent cell preparations, *P < 0.05). (B) EC monolayers were treated with cytochalasin D (cyto; 1 μmol/L), forskolin (FSK; 10 μmol/L) or vehicle (C; control) for indicated time points and cAMP levels were measured by ELISA. (Mean ± SEM of three experiments of independent cell preparations, *P < 0.05). (C) Effect of AC inhibition on EC barrier recovery. EC monolayers were exposed to thrombin (Thr; 0.3 IU/mL) in the absence or presence of AC inhibitor MDL12330 (10 and 25 μmol/L) or vehicle (control) as indicated and albumin flux (permeability) was measured. Mean ± SEM of three experiments of independent cell preparations; *P <0.05 versus control, #P <0.05 versus Thr alone.
