Figure 4.

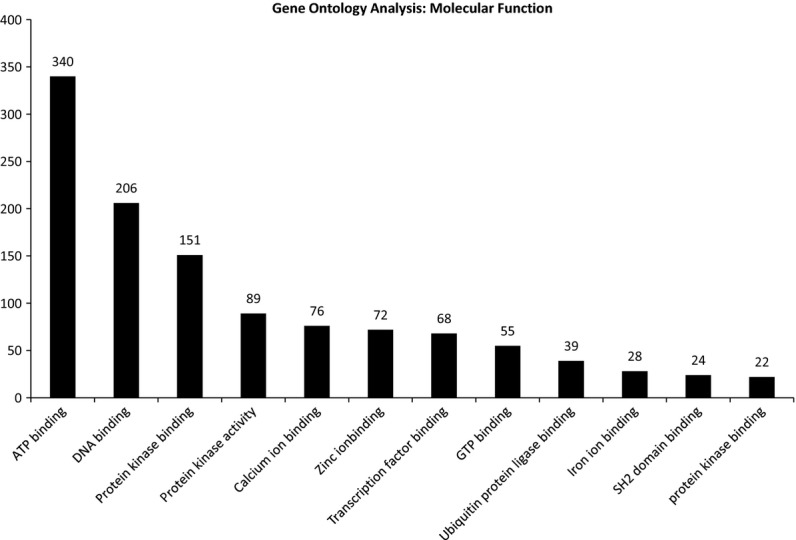
A bar graph of the most common molecular functions found for target proteins following Gene Ontology analysis using Automated Bioinformatics Extractor (ABE, http://helixweb.nih.gov/ESBL/ABE/).

A bar graph of the most common molecular functions found for target proteins following Gene Ontology analysis using Automated Bioinformatics Extractor (ABE, http://helixweb.nih.gov/ESBL/ABE/).