
Figure 4.
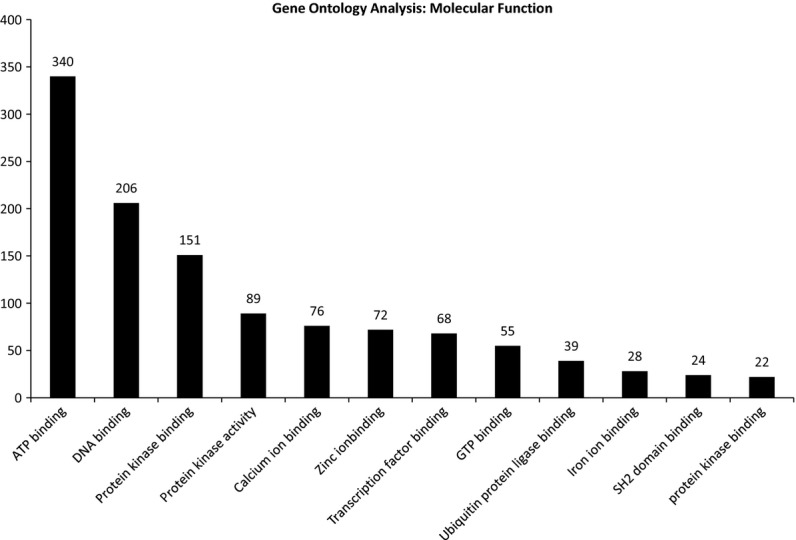
A bar graph of the most common molecular functions found for target proteins following Gene Ontology analysis using Automated Bioinformatics Extractor (ABE, http://helixweb.nih.gov/ESBL/ABE/).
Official websites use .gov
A
.gov website belongs to an official
government organization in the United States.
Secure .gov websites use HTTPS
A lock (
) or https:// means you've safely
connected to the .gov website. Share sensitive
information only on official, secure websites.
A bar graph of the most common molecular functions found for target proteins following Gene Ontology analysis using Automated Bioinformatics Extractor (ABE, http://helixweb.nih.gov/ESBL/ABE/).