
Figure 2.
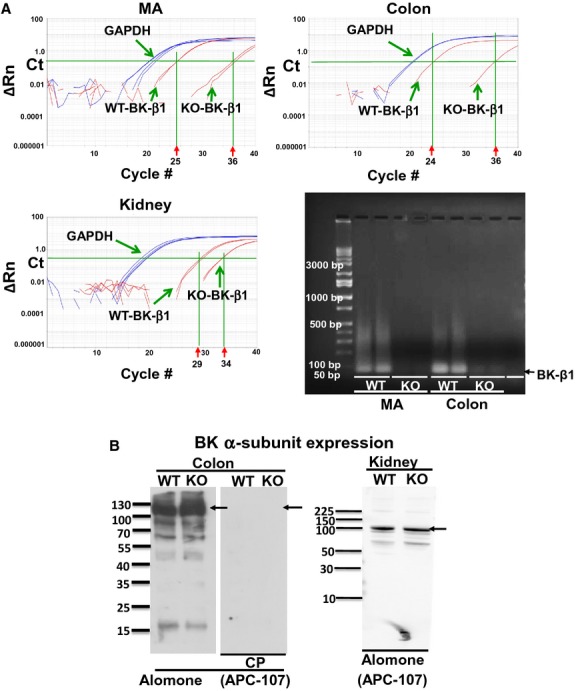
(A) Representative amplification plots and agarose gel separation of real‐time RT‐PCR analysis of BK β1‐subunit and GAPDH in MA, colons, and kidneys from WT and BK β1‐KO mice. The expression threshold was set at 0.22, a level above background fluorescence but within the linear phase of the amplification plot. The intersection between the threshold level and the amplification plot is the Ct value, which correlates with the amount of template in the sample. Ct values over 35 are excluded, as these values approach the sensitivity limits of the Taqman assay. Amplification of real‐time RT‐PCR products was seen at 75 bp in tissues from WT animals only. Con, nontemplate control. (B) Representative western blot obtained using anti‐BK α‐subunit antibody in colonic and kidney tissues from WT and BK β1‐KO mice. Antibody detected a protein band at ~100 kDa in all tissues from WT and BK β1‐KO mice. The signals are blocked by preincubation with the antibody competing peptide (CP). Arrows indicate the manufacturer's recommended molecular weight of BK α‐subunit protein.