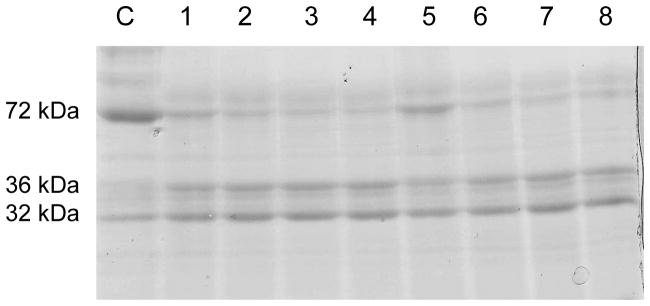
Figure 4.

The in vitro processing of the Cry11Aa toxin was the same in WT and resistant G30 larvae midgut. Cry11Aa protoxin was incubated with midgut protein extract that included midgut proteases and then analyzed in SDS-PAGE gel. Lanes: C - control; lanes - 1, 2, 3 and 4: 5, 10, 15 and 20 min with WT midgut extract, respectively; lanes – 5, 6, 7, and 8: 5, 10, 15 and 20 min with G30 resistant strain midgut extract, respectively. The stained band densities (the sum of the gray values of all the pixels in the selection divided by the number of pixels) were measured and quantified with Image J software (NIH) and analyzed with Origin program (Origin Lab). Band densities of the 72 kDa protoxin incubated at same time were similar; lane 1 (28) and 5 (30) of 5 min, 2 (23) and 6 (20) of 10 min, 3 (21) and 7 (17) of 15 min, 4 (20) and 8 (18) of 20 min (Table S2).
