Figure 1.
Analysis of scleral inflation data
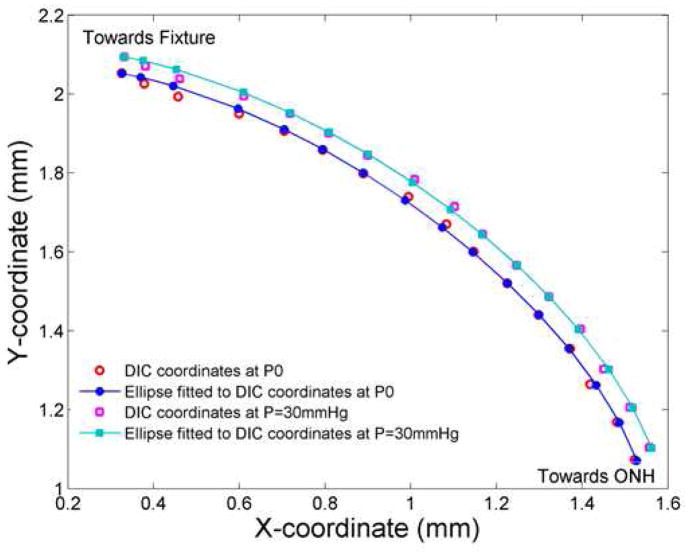
X and Y DIC coordinates (raw values) are shown from the nasal scleral edge for an eye at P0 (red circles) and P=30 mm Hg (purple squares). The ellipse fitted points (using DIC values) at P0 (filled blue circles and line) and deformed positions at P=30 mm Hg for the same eye (teal squares and line). The comparison of raw data points and the fitted ellipse show the modest degree of smoothing that occurred (see Section 2.4. Biomechanical Inflation Testing).

