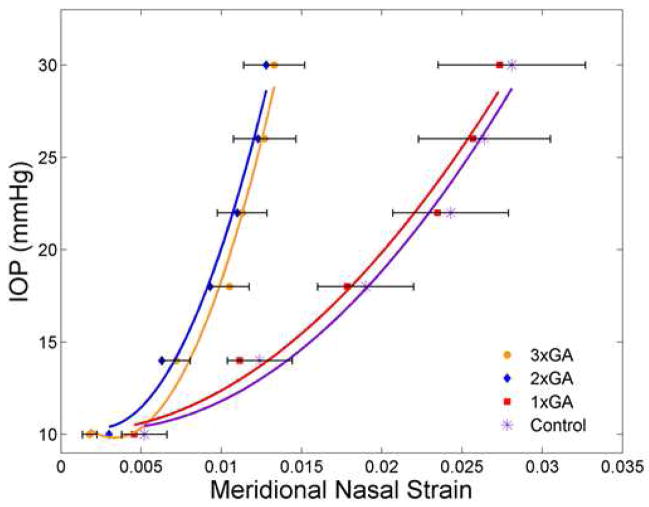
Figure 2.
Comparison of IOP—strain for GA-treated and control sclera
The mean IOP—strain values are plotted for 4 groups of mice with loading from reference IOP to 30 mm Hg. The groups are Control (purple asterisk) and 1x treatment with GA (red square) at the right and 2x treatment with GA (blue diamond) and 3x treatment with GA (orange circle) at the left. Standard error bars are shown for control and 3x GA groups. The fitted lines have also been added (for each group) in each respective color. Data from the nasal meridional analysis (temporal meridional and circumferential analyses gave similar results) show the significant stiffening effect after either 2 or 3 treatments with GA.

