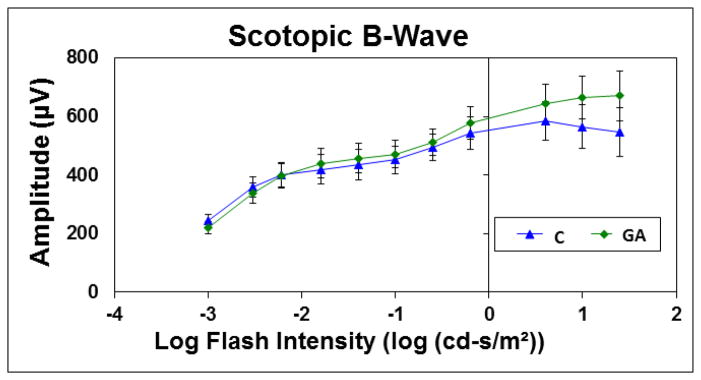
Figure 3.

Electroretinogram data for Scotopic B-Wave
The graph plots the mean amplitude for control (blue triangles, N=5) and glyceraldehyde treated eyes (green diamonds, N=5) at 10 different scotopic, B-wave, flash intensities (amplitudes in μV (microvolts)).
