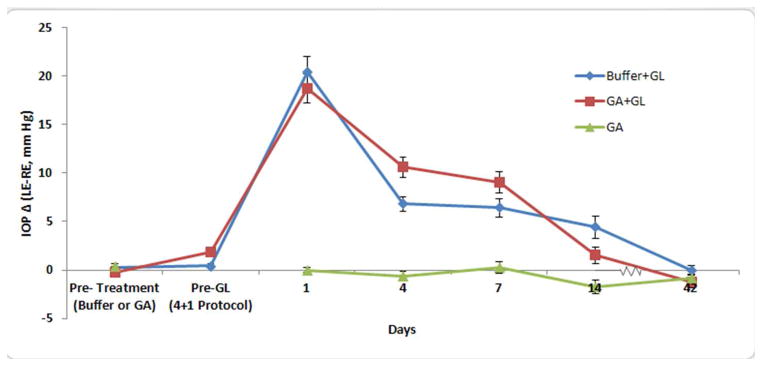
Figure 5.

IOP Difference for Buffer+GL, GA+ GL and GA groups
Mean paired IOP difference between left eyes (treated) and right eyes (control) of each animals. From glaucoma experiment 1, the buffer-injected (blue diamonds, N=41) and GA-injected (red squares, B=40) show no significant increase pre-glaucoma (GL) induction after their subconjunctival injection sequences (both p > 0.4). After glaucoma induction both GA and buffer groups have significant elevations through the first 2 weeks (p <0.0001), but no significant difference between the two experimental groups (all p > 0.27). Animals that were injected with GA alone, but without glaucoma induction had no change in IOP (at either 1, 4, 7, 14 or 42 days) in their injected compared to control eyes (green triangles, N=10). Mean paired difference +/− standard error.
