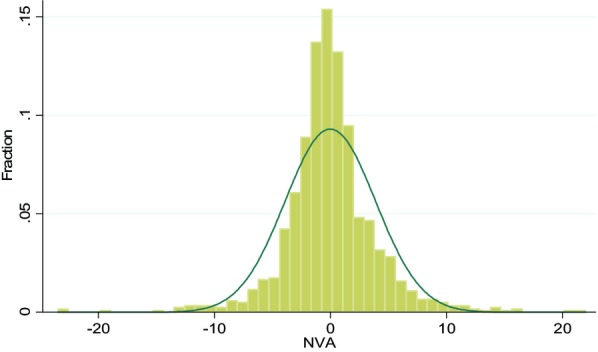
Figure 2.

Frequency Distribution of Nurse Value-Added (NVA), N = 1,203 Note. The figure shows a frequency histogram of the standardized nurse fixed effect estimates, using change in patient condition as the dependent variable and a covariate adjusted value-added modeling (VAM) regression with nurse fixed effects. Other controls include patient characteristics and diagnosis, unit, care team, and calendar fixed effects. The superimposed distribution is normal with the same first and second moments.
