
Figure 1.
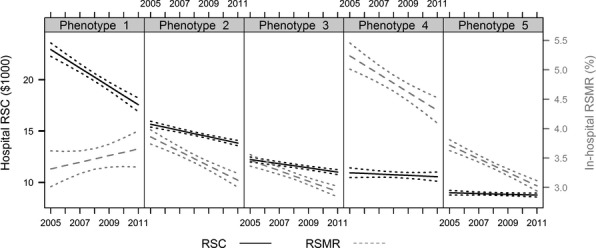
Distinct Hospital Phenotypes Identified by Jointly Modeling the Longitudinal Trajectory of In-Hospital Risk-Standardized Cost (RSC) and Risk-Standardized Mortality Rate (RSMR) Dotted lines reflect confidence intervals for each trajectory, based on the 95 percent confidence intervals of the point estimates in each year Phenotype 1: Highest cost and low mortality (n = 14 hospitals, 3.2 percent of the hospitals in sample) Phenotype 2: High cost and low mortality (n = 86 hospitals, 20.4 percent of the hospitals in sample) Phenotype 3: Medium cost and low mortality (n = 147 hospitals, 34.6 percent of the hospitals in sample) Phenotype 4: Medium cost and high mortality (n = 26 hospitals, 6.2 percent of the hospitals in sample) Phenotype 5: Low cost and low mortality (n = 151 hospitals, 35.6 percent of the hospitals in sample)