
Figure 9.
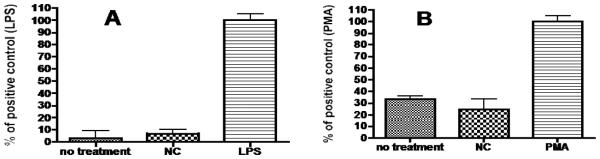
Optimized NC does not trigger (A) NO production or (B) reactive oxygen intermediate (ROI) production. Triplicates of rat peritoneal resting macrophages were plated at 105/well in 96-well plates and the cells were left in culture for 4 hrs for attachment to take place. The cells were then treated with the optimized 2-unit mannose/12 kDa PEG-NC (NC), NO positive control lipopolysaccharides (LPS) at 500 ng/ml, or ROI positive control PMA at 500 ng/ml. The group of cells with no treatment was used as the negative control. The cells in wells were then assayed for NO production using the Sigma NO kit or for ROI production using Sigma NBT kit. Data is expressed as % of positive control. Each graph represents the mean +/− s.d. of three independent experiments. The difference between positive control and NC is statistically significant (p < 0.001) for both assays.