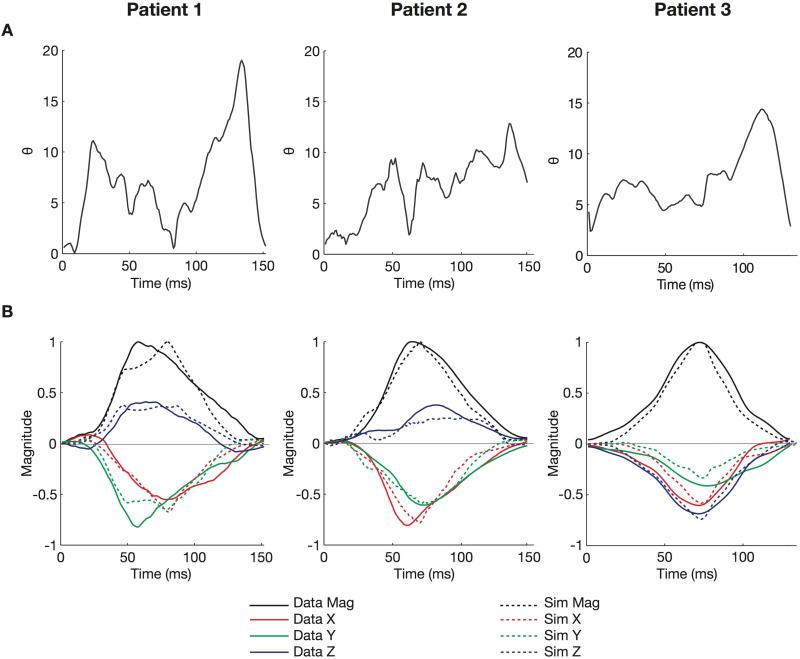
Figure 3.
Summary comparisons between optimal and measured VCGs. (A) The time course of the cost value Θ(°) during activation. (B) Comparison of the peak-normalized magnitude (Mag), X, Y, and Z components of the optimal simulated (dashed line) and measured (solid line) VCGs (for Kors transformation).

