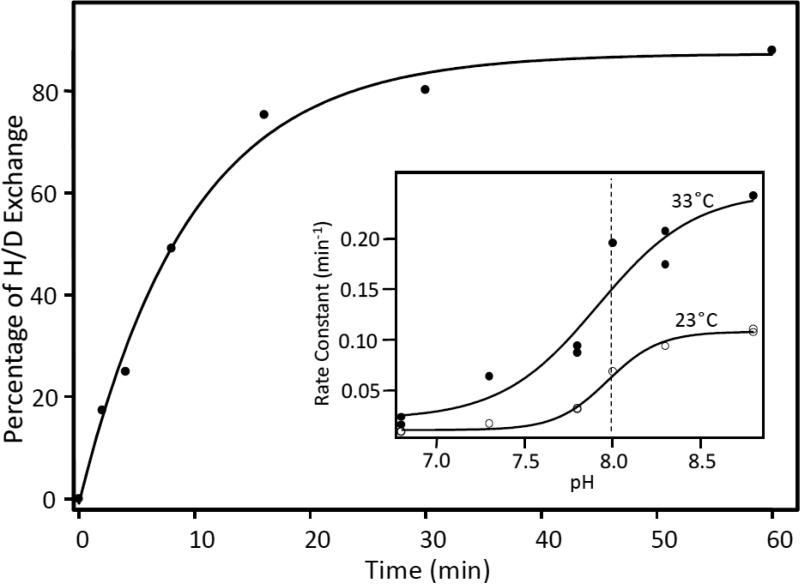
Fig. 9.
The percentage of H/D exchange determined from the amplitude factors in Fig. 8 are plotted as a function of the H/D exchange time. The solid line shows the best single exponential fit of the data. The inset shows the rate constants as a function of pH at 23 and 33 °C.

