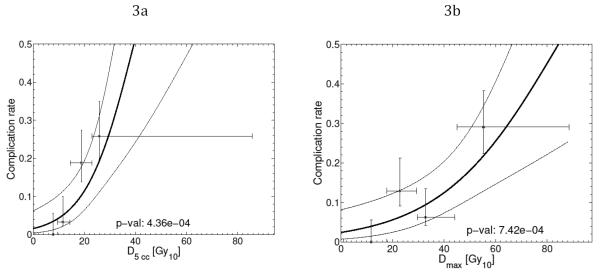
Figure 2.
Fitted logistic regression response functions for grade ≥ 2 acute esophageal toxicity models (bold line), based on D5cc (a) and Dmax (b). Dose variables are BED10 values. 95% confidence intervals on the response rates are shown by the thin lines. For comparison, observed complication rates for quartiles in the respective dose variables are plotted as points at the quartile median dose value with associated ranges (horizontal bars) together with their 68% confidence intervals (vertical bars).

