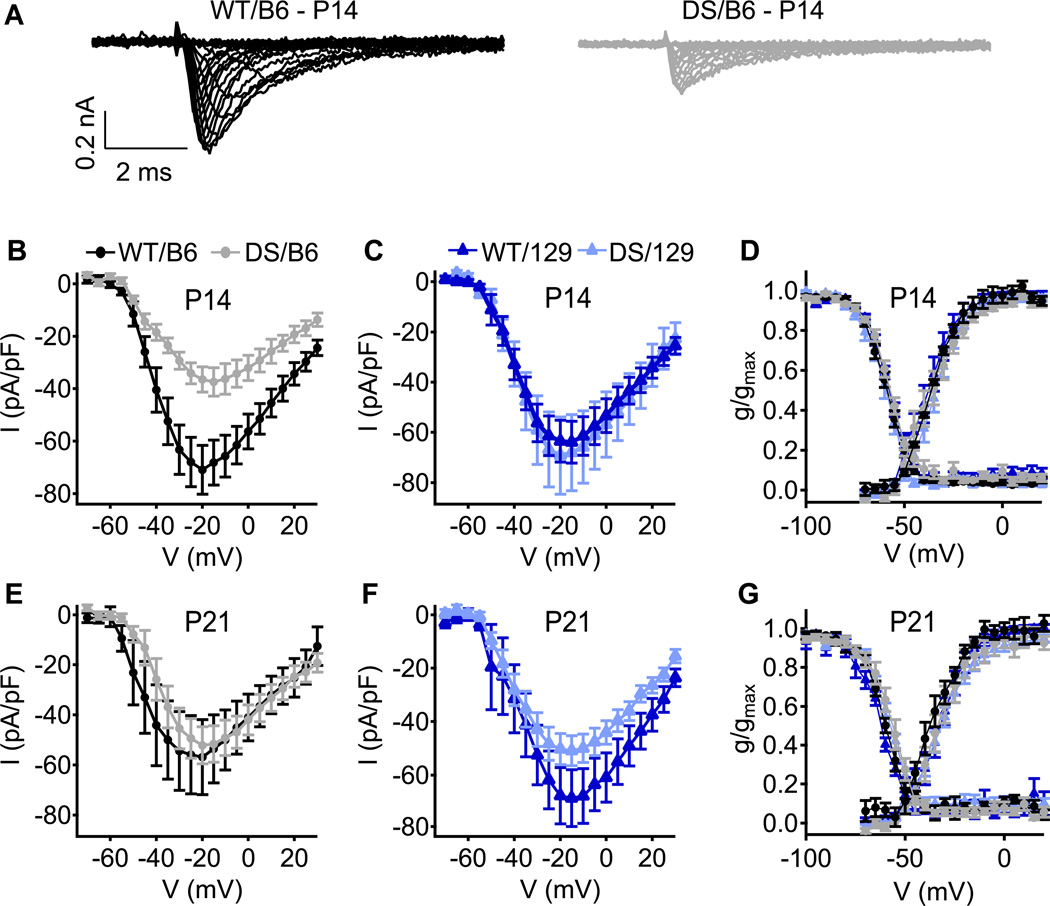
Fig. 2. Sodium currents of WT and DS in acutely dissociated hippocampal inhibitory neurons.
(A) Representative sets of sodium current traces from inhibitory neurons of WT/B6 and DS/B6 at P14. (B, C) Current–voltage relationships of whole-cell sodium currents from B6 (B) and 129 (C) interneurons at P14. (D) Voltage dependence of activation (right curves) and steady-state inactivation (left curves) of sodium currents at P14 (E, F) Current–voltage relationships of whole-cell sodium currents from B6 (E) and 129 (F) interneurons at P21. (G) Voltage dependence of activation (right curves) and steady-state inactivation (left curves) of sodium currents at P21. n=11–16.

