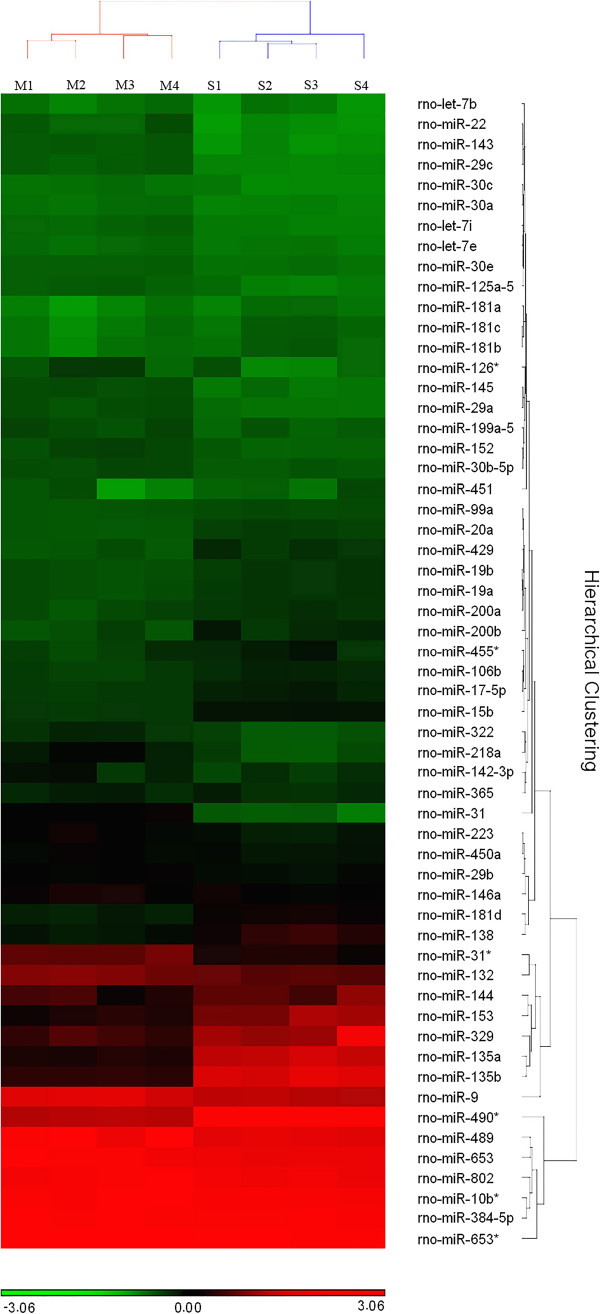
Figure 1.

Hierarchical clustering analysis of the expression levels of miRNAs with highest variability (Coefficient of Variance (CV) >0.15) across all samples. All four pairs of samples are labeled in acronyms (Maturation-stage RNA sample 1–4: M1-4, Secretory-stage RNA sample 1–4: S1-4). The color scale from red to green indicates relative abundance of miRNAs from higher to lower.
