Figure 4.

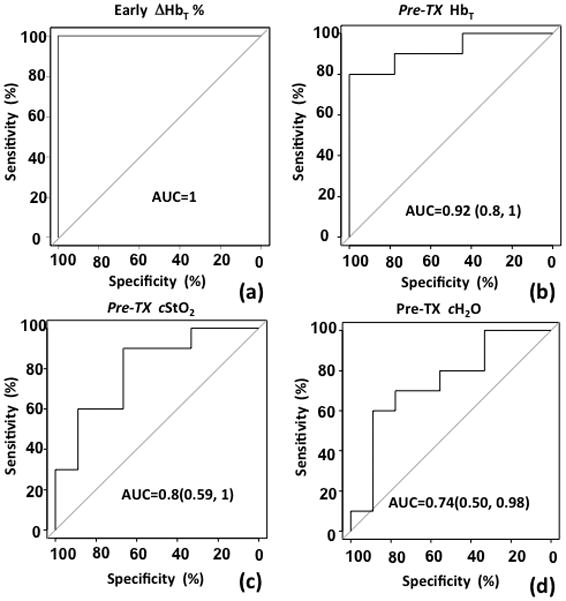
AUC curves are shown for (a) early percentage changes of tumor HbT between the Pre-Tx and the last imaging session in the first NAC cycle, and (b) Pre-TxHbT, (c) Pre-Tx contrast in StO2, and (d) Pre-Tx contrast in H2O.

AUC curves are shown for (a) early percentage changes of tumor HbT between the Pre-Tx and the last imaging session in the first NAC cycle, and (b) Pre-TxHbT, (c) Pre-Tx contrast in StO2, and (d) Pre-Tx contrast in H2O.