
Figure 3.
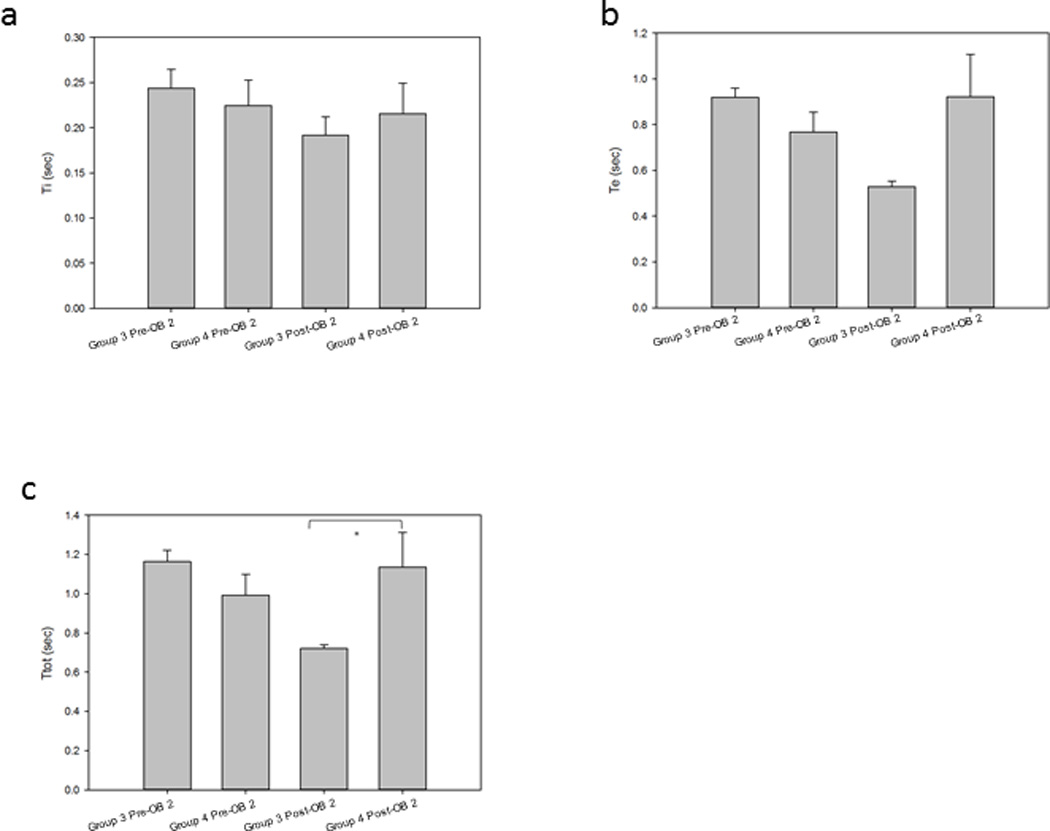
Group mean respiratory phase timing in OB-2 animals.
a. Ti: Group 3 Ti 0.24±0.05 was not significantly different than Group 4 Ti 0.22±0.06 Pre-OB-2 breath times (p=0.591). Group 3 Ti 0.19±0.05 was not significantly different than Group 4 Ti 0.22±0.08 Post-OB-2 breath times (p=0.544).
b. Te: Group 3 Te 0.92±0.10 was not significantly different than Group 4 Te 0.77±0.19 Pre-OB-2 breath times (p=0.124). Group 3 Te 0.53±0.06 was not significantly different than Group 4 Te 0.92±0.42 Post-OB-2 breath times (p=0.126).
c. Ttot: Group 3 Ttot 1.16±0.14 was not significantly different than Group 4 Ttot 0.99±0.24 Pre-OB-2 breath times (p=0.175). Group 3 Ttot 0.72±0.05 was significantly different than Group 4 Ttot 1.14±0.39 Post-OB-2 breath times (p=0.030).