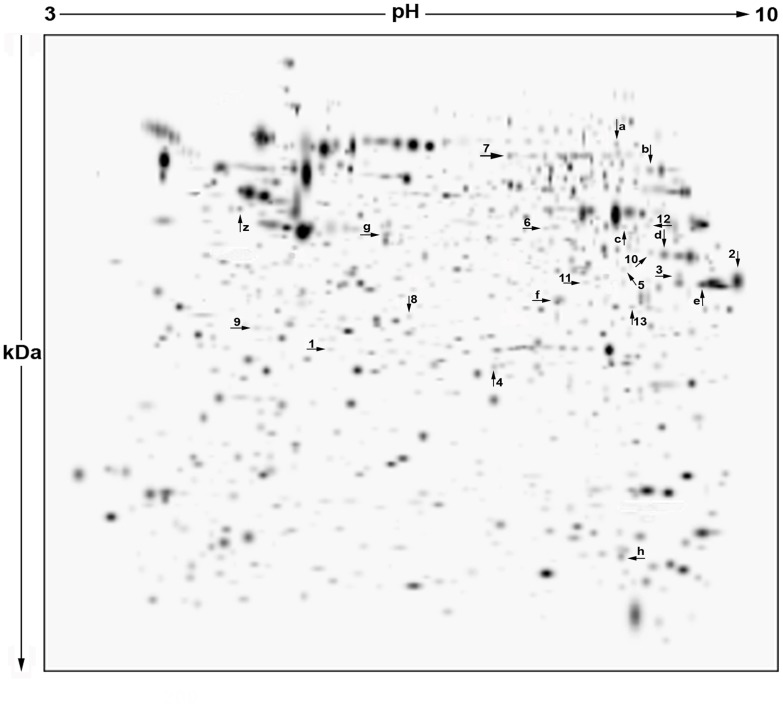
Figure 2. Two-dimensional electrophoretic map of proteins in Lymphoblastoid B-cells from individuals belonging to the family described in Figure 1 .
The virtual image reported here (Higher Master Gel, HMG), results from the correlation of master gels from each group of subjects and contains all the common and uncommon spots among groups of comparison. Spots differentially expressed among groups of subjects have been labeled by arrows with letters and numbers. Proteins contained in altered spots indicated by letters (a to h) were identified by gel-matching; those in spots arbitrarily indicated by numbers (1 to 13), by LC-MS/MS. For additional experimental details, see the text.

