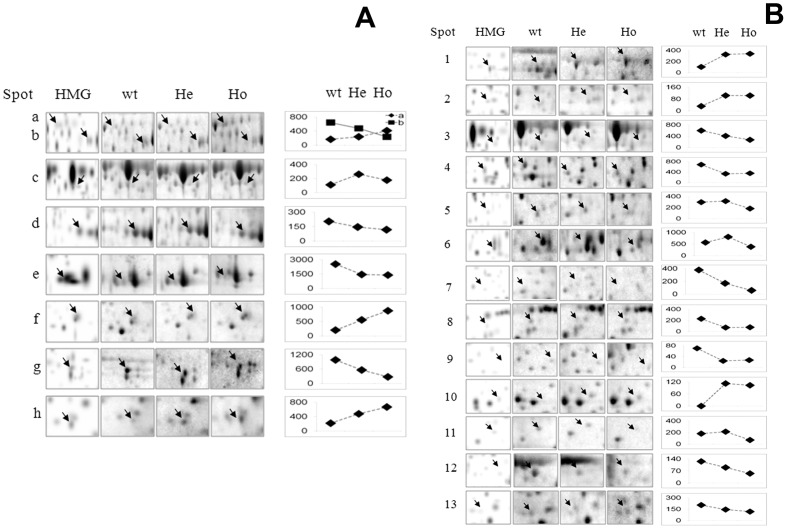
Figure 3. The zoomed region of each real stained gel in which altered spot (indicated by an arrow) is positioned, is shown in this figure.
A single magnified gel view (representative of all others) for each group was horizontally aligned to highlight differences in spot density among groups. Aside of each horizontal set of panels, a graphical representation of changes was also reported. Spots a to h are shown in panel A; spots 1 to 13 are shown in panel B.

