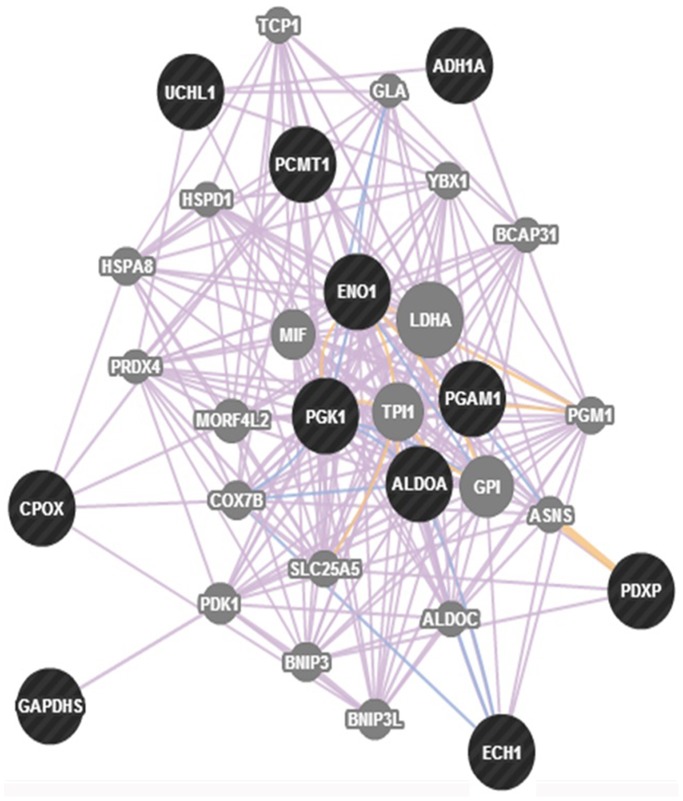
Figure 4. Gene network analysis obtained by navigating through the differentially expressed energy metabolic proteins identified in this study by using the GeneMANIA algorithm.
Circles in black evidence genes encoding deregulated proteins used to generate the map and circles in grey evidence new genes that are functionally associated with the formers.

