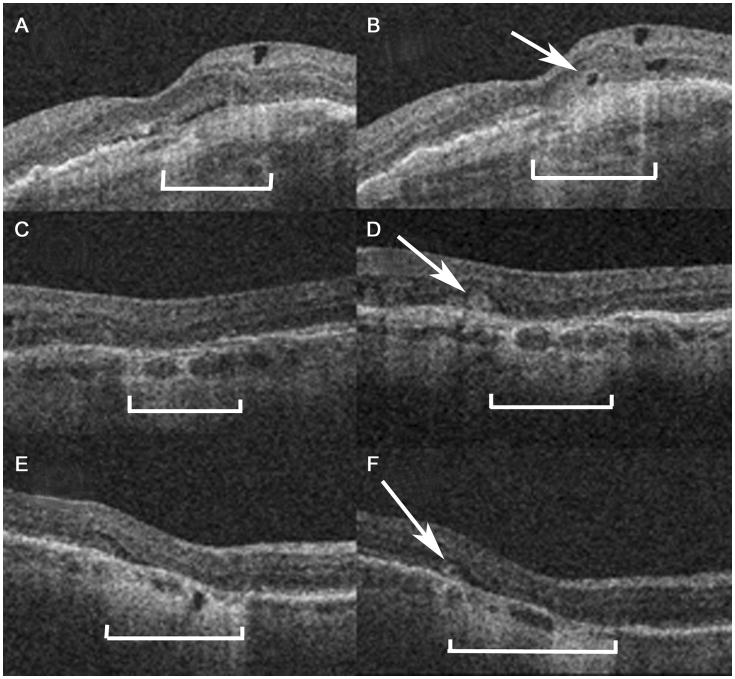
Figure 2.
Representative OCT images at week 56 (A, C, E) and week 104 (B, D, F) in three eyes without ORT at week 56 but with ORT (arrows) at week 104. ORTs are seen adjacent to areas of geographic atrophy, seen as photoreceptor layer thinning above an area of increased light penetration into the choroid (brackets).
*ORT = outer retinal tabulation

