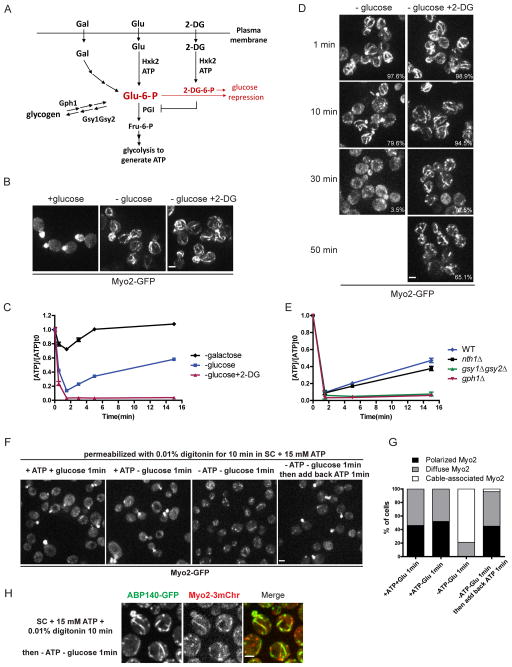
Figure 2. Myo2 localization correlates with intracellular ATP level.
(A) Schematic diagram of the entry of glucose, galactose, 2-DG and glycogen into the glycolytic pathway in yeast cells.
(B) Cells grown in SC were transferred to fresh SC (left), SC lacking glucose (center) or SC with 2% 2-DG and no glucose (right).
(C) ATP levels in cells after glucose depletion (blue), galactose depletion (black) or glucose depletion and 2-DG addition (red). ATP concentrations are normalized to pre-starved cells. Error bars represent SD.
(D) Myo2-GFP in cells depleted of glucose with or without 2-DG after prolonged incubation. Percentage of cells containing Myo2 fibers is shown in the lower right corner. At least 200 cells were scored for each condition.
(E) ATP levels in cells after growth to early/mid-log phase in SC at times after glucose depletion. ATP concentrations are normalized to pre-starved cells. Error bars represent SD.
(F) Cells expressing Myo2-GFP were permeabilized as described in Materials and Methods and transferred to the conditions as indicated.
(G) Quantification of Myo2-GFP localization in (F). At least 200 cells were scored for each condition.
(H) Cells expressing Myo2-3mCherry and ABP140-GFP were permeabilized and depleted of glucose and ATP for 1 min. All scale bars, 2 μm.

