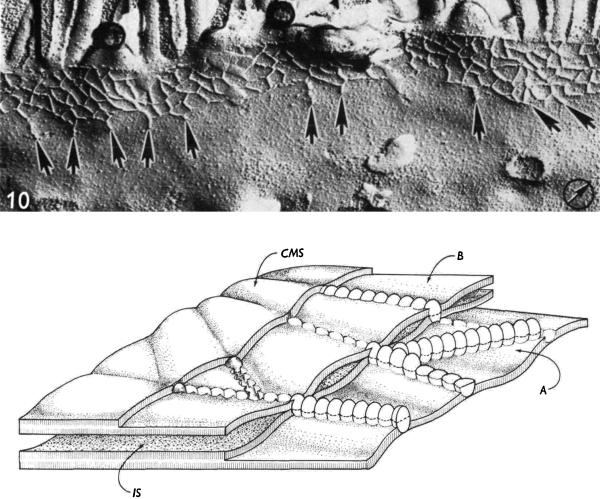
Fig. 1.
Freeze fracture electron microscopic image and diagram of a tight junction. Top, FFEM image from rat jejunum showing a gradient of strand organization from the lateral to apical side of the junction. One continuous apical strand is typically followed by a network of interconnected strands and on the basal side the strands can be free and unconnected to the network. Bottom, An artist's view of a tight junction as seen in FFEM. The diagram is of two fracture planes in apposed tight junction membranes. (A) Rows of particles in one fracture plane that become a meshwork after glutaraldehyde fixation and (B) grooves, modeled in the front fibrils of this second fracture plane. IS, intercellular space and CMS, cytoplasmic membrane surface. Reproduced with permission from Staehelin, 1973.

