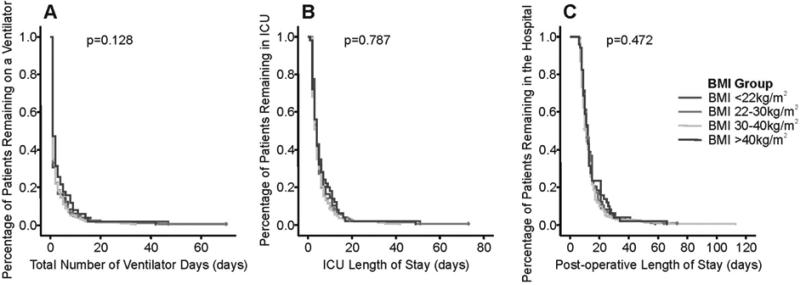
Figure 2. Kaplan-Meier Time to event curves for Ventilator Days (Panel A), ICU Days (Panel B) and Post-operative Length of Stay (Panel C).
Among the four BMI groups, there were no significant differences in median number of ventilator days (log rank p=0.128), median number of ICU days (log rank p=0.787) or in median number of post-operative days (log rank p=0.472). The four in-hospital deaths were censored and are represented by tick marks on the curve.

