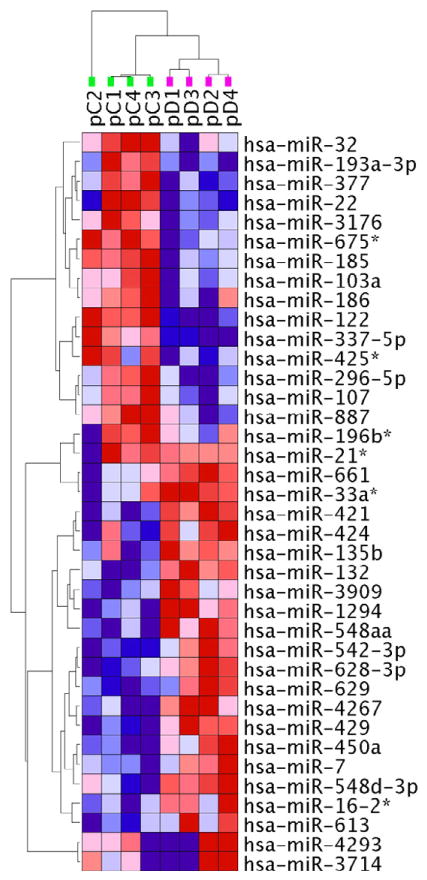
Figure 2. Clustering of miRNAs that are differentially expressed between the MDD and CNTR samples.
miRNA levels were assessed in 8 pooled samples (4 CNTR + 4 MDD) using miRNome PCR Arrays. 38 miRNAs reported differential expression between fibroblasts from MDD patients and healthy controls. Unsupervised two-way hierarchical clustering of these miRNA expression levels provided a clear separation between the MDD and CNTR samples. Samples were clustered vertically, miRNAs were clustered horizontally. Each colored square represents a normalized miRNA expression level, color coded for increase (red) or decrease (blue) from the mean. Color intensity is proportional to magnitude of change. The clustering resulted in a separation of the samples into two groups, perfectly matching the two distinct diagnostic categories (vertical dendrogram: green - CNTR samples, purple – MDD samples). For more detail, see Supplemental Figure S2.

