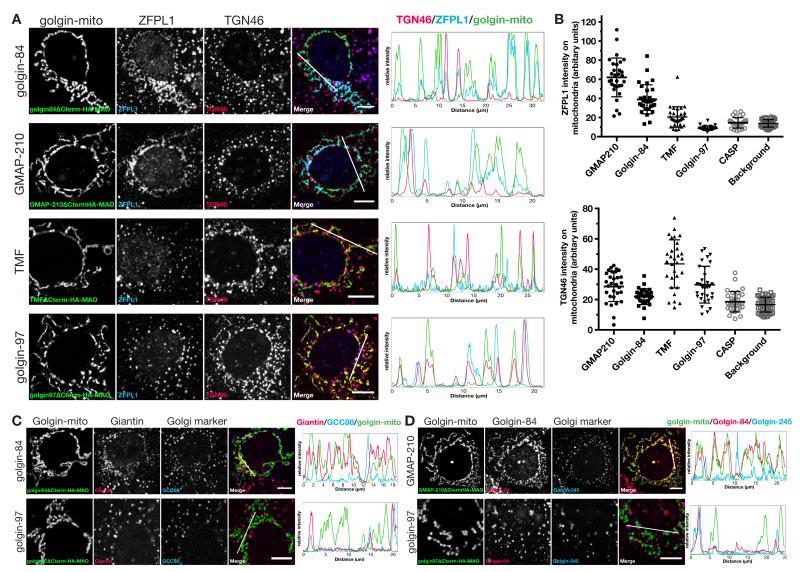
Fig. 6. TMF, golgin-84 and GMAP210 exhibit specificity in the capture of cis-Golgi and trans-Golgi residents.
(A) COS cells expressing the indicated golgin-mito were treated with nocodazole for 6 hours and costained for two transmembrane Golgi markers, ZFPL1 (cis) and TGN46 (trans). Intensity plots of signal intensity (y-axis) against distance in μm (x-axis) show occurrence of overlap between channels. (B) Quantitation of mean intensity of ZFPL1 signal and TGN46 signal within the HA-positive mitochondria segment (the golgins) or whole cell (background), n ≥ 30. (C,D) COS cells expressing the indicated golgin-mito were treated with nocodazole for 6 hours and costained for either of the transmembrane golgins, giantin or golgin-84, and a Golgi marker, GCC88. Intensity plots of signal intensity (y-axis) against distance in μm (x-axis) show occurrence of overlap between the markers. Scale bars 10 μm or 5 μm (magnified boxes).

