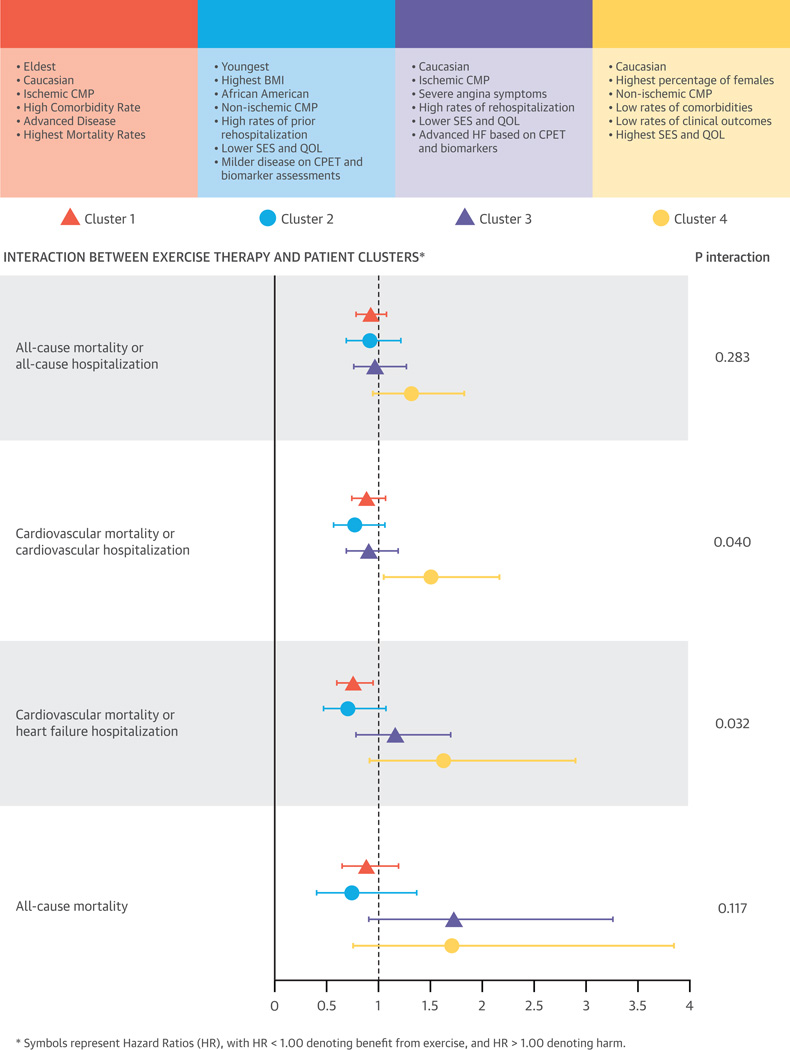
Central Illustration. Consort diagram showing cluster methodology applied to HF-ACTION study and the four distinct clusters that emerge.
Interaction between exercise therapy and patient clusters extracted from the study. Symbols represent Hazard Ratios (HR) and 95 % Confidence Intervals (CI), with HR < 1.00 denoting benefit from exercise, and HR > 1.00 denoting harm.

